Results External Trade
Results sheet management in External trade: export and import figures
Results sheet management in External trade: export and import figures
daily and weekly market (market allocation depending on the nature and condition of operation) 2015
|
NATURE OF THE MARKET |
NUMBER OF STEPS |
LEGAL |
|
|
AUTHORISED |
NOT-AUTHORISED |
||
|
WEEKLY WORK |
10 |
07 |
03 |
|
DAILY MARKET |
15 |
12 |
03 |
|
COVERED MARKET |
12 |
12 |
00 |
|
WHOLESALE MARKET OF FRUIT AND VEGETABLES |
01 |
01 |
00 |
|
TOTAL |
38 |
32 |
06 |
The overall development of the business until 30 JUNE 2015:
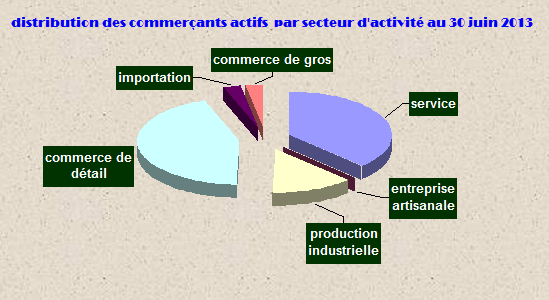
the updating operation of data sheets economic operators active in various sectors of trade, allowed to be completed during the first half of the year 2013 at a total estimated number of traders: 30201 traders with a rate an increase of 3.5% compared to the number of traders from the previous year, most of them engaged in activities related to the sectors of retail and services (respectively 13 233 and 11 325 merchants), producers have been identified this year: 3956 with a rate of 13.1% of the total number of economic operators, most of which are engaged in activities related to the field of construction and public works, while traders numbers recorded in the sectors import (p.morale) and the wholesale trade, are, respectively, 719 and 857.
The table below clearly shows the distribution of main registrations (traders) by business and the legal nature until June 30, 2015 :
The distribution of assets by business traders at June 30, 2015:
|
legal nature Activity area |
Physical person |
Corporation |
Total |
|
Industrial production |
3103 |
853 |
3956 |
|
Import |
89 |
719 |
808 |
|
Wholesale |
666 |
191 |
857 |
|
Retail business |
13124 |
109 |
13233 |
|
Services |
10822 |
503 |
11325 |
|
craft production |
16 |
06 |
22 |
|
Total |
27820 |
2381 |
30201 |
The graphic representation of the distribution of assets by business traders at June 30, 2015:
Distribution by common until the month of June 2015
| Total Commune | Services | Commerce de détail | Importation | Commerce de Gros | Production artisanale | Production Indistruel | Commune | ||||||||||||||
| Tot | M | P | Tot | M | P | Tot | M | P | Tot | M | P | Tot | M | P | Tot | M | P | Tot | M | P | |
| 18931 | 1806 | 17125 | 7023 | 364 | 6659 | 8185 | 87 | 8098 | 690 | 605 | 85 | 623 | 145 | 478 | 12 | 2 | 10 | 2398 | 603 | 1795 | BBA |
| 1715 | 77 | 1638 | 523 | 19 | 504 | 926 | 7 | 919 | 20 | 19 | 1 | 30 | 3 | 27 | 3 | 0 | 3 | 213 | 29 | 184 | Ras El Oued |
| 226 | 5 | 221 | 76 | 1 | 75 | 122 | 0 | 122 | 0 | 0 | 0 | 2 | 0 | 2 | 1 | 0 | 1 | 25 | 4 | 21 | Bordj Zemmoura |
| 623 | 37 | 586 | 240 | 9 | 231 | 292 | 0 | 292 | 8 | 8 | 0 | 16 | 5 | 11 | 2 | 2 | 0 | 65 | 13 | 52 | Mansourah |
| 494 | 17 | 477 | 214 | 4 | 210 | 215 | 1 | 214 | 2 | 2 | 0 | 27 | 2 | 25 | 0 | 0 | 0 | 36 | 8 | 28 | El Mhir |
| 125 | 0 | 125 | 70 | 0 | 70 | 41 | 0 | 41 | 0 | 0 | 0 | 3 | 0 | 3 | 0 | 0 | 0 | 11 | 0 | 11 | Ben Daoued |
| 778 | 60 | 718 | 305 | 9 | 296 | 326 | 2 | 324 | 24 | 23 | 1 | 28 | 5 | 23 | 0 | 0 | 0 | 95 | 21 | 74 | El Achir |
| 284 | 15 | 269 | 134 | 4 | 130 | 107 | 0 | 107 | 0 | 0 | 0 | 6 | 3 | 3 | 0 | 0 | 0 | 37 | 8 | 29 | Ain Taghrout |
| 955 | 48 | 907 | 282 | 9 | 273 | 459 | 1 | 458 | 17 | 16 | 1 | 14 | 2 | 12 | 0 | 0 | 0 | 183 | 20 | 163 | Bordj Ghdir |
| 341 | 21 | 320 | 131 | 4 | 127 | 151 | 1 | 150 | 3 | 3 | 0 | 6 | 3 | 3 | 0 | 0 | 0 | 50 | 10 | 40 | Sidi Mbarek |
| 642 | 33 | 609 | 228 | 8 | 220 | 279 | 0 | 279 | 5 | 5 | 0 | 23 | 5 | 18 | 0 | 0 | 0 | 107 | 15 | 92 | El Hamadia |
| 260 | 12 | 248 | 122 | 5 | 117 | 92 | 0 | 92 | 2 | 2 | 0 | 4 | 0 | 4 | 0 | 0 | 0 | 40 | 5 | 35 | Belimour |
| 751 | 68 | 683 | 271 | 20 | 251 | 330 | 1 | 329 | 12 | 12 | 0 | 18 | 4 | 14 | 0 | 0 | 0 | 120 | 31 | 89 | Medjana |
| 79 | 2 | 77 | 27 | 1 | 26 | 46 | 0 | 46 | 0 | 0 | 0 | 0 | 0 | 0 | 0 | 0 | 0 | 6 | 1 | 5 | Thiet Elnasr |
| 201 | 5 | 196 | 93 | 1 | 92 | 50 | 0 | 50 | 0 | 0 | 0 | 0 | 0 | 0 | 1 | 1 | 0 | 57 | 3 | 54 | Djaafra |
| 81 | 2 | 79 | 30 | 0 | 30 | 33 | 0 | 33 | 0 | 0 | 0 | 3 | 0 | 3 | 1 | 0 | 1 | 14 | 2 | 12 | El Main |
| 60 | 3 | 57 | 31 | 1 | 30 | 17 | 0 | 17 | 0 | 0 | 0 | 0 | 0 | 0 | 0 | 0 | 0 | 12 | 2 | 10 | Ouled Brahem |
| 493 | 3 | 490 | 160 | 0 | 160 | 314 | 0 | 314 | 0 | 0 | 0 | 0 | 0 | 0 | 0 | 0 | 0 | 19 | 3 | 16 | Ouled Dahmen |
| 518 | 19 | 499 | 204 | 3 | 201 | 251 | 0 | 251 | 5 | 5 | 0 | 6 | 2 | 4 | 0 | 0 | 0 | 52 | 9 | 43 | Hasnaoua |
| 512 | 27 | 485 | 228 | 13 | 215 | 207 | 1 | 206 | 2 | 2 | 0 | 4 | 1 | 3 | 0 | 0 | 0 | 71 | 10 | 61 | Khllil |
| 60 | 2 | 58 | 20 | 0 | 20 | 34 | 0 | 34 | 0 | 0 | 0 | 1 | 0 | 1 | 0 | 0 | 0 | 5 | 2 | 3 | Taglait |
| 177 | 3 | 174 | 82 | 1 | 81 | 60 | 0 | 60 | 0 | 0 | 0 | 0 | 0 | 0 | 0 | 0 | 0 | 35 | 2 | 33 | El Ksour |
| 41 | 1 | 40 | 22 | 0 | 22 | 12 | 0 | 12 | 0 | 0 | 0 | 0 | 0 | 0 | 0 | 0 | 0 | 7 | 1 | 6 | Ouled Sidi Brahim |
| 34 | 0 | 34 | 19 | 0 | 19 | 7 | 0 | 7 | 0 | 0 | 0 | 0 | 0 | 0 | 0 | 0 | 0 | 8 | 0 | 8 | Tefreg |
| 150 | 4 | 146 | 68 | 2 | 66 | 42 | 0 | 42 | 0 | 0 | 0 | 6 | 0 | 6 | 0 | 0 | 0 | 34 | 2 | 32 | El Colla |
| 128 | 6 | 122 | 62 | 2 | 60 | 45 | 1 | 44 | 0 | 0 | 0 | 1 | 0 | 1 | 0 | 0 | 0 | 20 | 3 | 17 | Tixter |
| 282 | 9 | 273 | 132 | 1 | 131 | 111 | 0 | 111 | 1 | 1 | 0 | 7 | 1 | 6 | 0 | 0 | 0 | 31 | 6 | 25 | El Euche |
| 418 | 54 | 364 | 140 | 9 | 131 | 164 | 4 | 160 | 9 | 9 | 0 | 21 | 8 | 13 | 1 | 0 | 1 | 83 | 24 | 59 | El Anasser |
| 94 | 2 | 92 | 45 | 1 | 44 | 40 | 0 | 40 | 0 | 0 | 0 | 0 | 0 | 0 | 0 | 0 | 0 | 9 | 1 | 8 | Tassameurt |
| 143 | 15 | 128 | 74 | 4 | 70 | 48 | 2 | 46 | 1 | 1 | 0 | 0 | 0 | 0 | 0 | 0 | 0 | 20 | 8 | 12 | Ain Tassera |
| 360 | 18 | 342 | 144 | 7 | 137 | 160 | 1 | 159 | 4 | 4 | 0 | 4 | 1 | 3 | 1 | 1 | 0 | 47 | 4 | 43 | Bir Kasd Ali |
| 117 | 4 | 113 | 53 | 1 | 52 | 37 | 0 | 37 | 2 | 1 | 1 | 3 | 1 | 2 | 0 | 0 | 0 | 22 | 1 | 21 | Ghilassa |
| 92 | 3 | 89 | 48 | 0 | 48 | 24 | 0 | 24 | 1 | 1 | 0 | 1 | 0 | 1 | 0 | 0 | 0 | 18 | 2 | 16 | Rabta |
| 36 | 0 | 36 | 24 | 0 | 24 | 6 | 0 | 6 | 0 | 0 | 0 | 0 | 0 | 0 | 0 | 0 | 0 | 6 | 0 | 6 | Haraza |
| 30201 | 2381 | 27820 | 11325 | 503 | 10822 | 13233 | 109 | 13124 | 808 | 719 | 89 | 857 | 191 | 666 | 22 | 6 | 16 | 3956 | 853 | 3103 | TOTAL |
Services Sector: (30/06/2015)
There at the wilaya 45 major companies active in the service sector, and the table below shows the technical information for some of these units:
the most important units activating in the field of services
|
Activity area |
Number of units |
Storage capacity |
Number of employees |
|
Car dealers |
10 |
3380 m2 |
/ |
|
Product Packaging |
01 |
60 tons (oil packaging) |
/ |
|
Gas station |
33 |
62.993.300 liters 40.000 m2 diesel |
263 |
|
Cold room |
01 |
5000 m2 |
/ |


![]() Address: Administrative center Boulevard Houari Boumedienne ,Skikda CP-21000 ; Phone: +213 038-70-30-13 ; Fax: +213 038.70.53.66 ; E-Mail: This email address is being protected from spambots. You need JavaScript enabled to view it.
Address: Administrative center Boulevard Houari Boumedienne ,Skikda CP-21000 ; Phone: +213 038-70-30-13 ; Fax: +213 038.70.53.66 ; E-Mail: This email address is being protected from spambots. You need JavaScript enabled to view it.